Performance Profiling
When a program is finished, our requirements for it are not just that it runs, but also that it's a stable and efficient application. Through various tests, we can ensure most of the program's stability. However, whether the program is efficient requires us to perform performance profiling. In previous content, the only means of performance profiling was through Benchmark to test the average execution time and memory allocation of a functional unit. However, in reality, the requirements for program performance analysis go far beyond this. Sometimes we need to analyze the program's overall CPU usage, memory usage, heap allocation, goroutine status, hot code paths, etc., which Benchmark cannot satisfy. Fortunately, the go toolchain integrates many performance profiling tools for developers to use. Let's explain them one by one.
Escape Analysis
In Go, memory allocation for variables is decided by the compiler, generally allocated to two places: the stack and the heap. If a variable that should have been allocated on the stack is allocated on the heap, this situation is called escape. Escape analysis is to analyze the memory allocation in the program. Since it's done at compile time, it's a form of static analysis.
TIP
Go to the Memory Allocation article to understand how Go specifically allocates memory.
Returning Local Pointers
package main

func main() {
  GetPerson()
}

type Person struct {
  Name string
  Mom  *Person
}

func GetPerson() Person {
  mom := Person{Name: "lili"}
  son := Person{Name: "jack", Mom: &mom}
  return son
}
In the GetPerson function, the mom variable is created. Since it's created within the function, it should have been allocated on the stack, but it's referenced by the Mom field of son, and son is returned as a function return value, so the compiler allocates it on the heap. This is a very simple example, so it doesn't take much effort to understand. But if it's a larger project with tens of thousands of lines of code, manual analysis wouldn't be so easy. Therefore, tools are needed for escape analysis. As mentioned earlier, memory allocation is led by the compiler, so escape analysis is also done by the compiler. It's very simple to use, just execute the following command:
$ go build -gcflags="-m -m -l"gcflags are parameters for the compiler gc:
-m, print code optimization suggestions, two-mwill output more details-l, disable inline optimization
Output as follows:
$ go build -gcflags="-m -m -l" .
# golearn/example
./main.go:13:2: mom escapes to heap:
./main.go:13:2:   flow: son = &mom:
./main.go:13:2:     from &mom (address-of) at ./main.go:14:35
./main.go:13:2:     from Person{...} (struct literal element) at ./main.go:14:15
./main.go:13:2:     from son := Person{...} (assign) at ./main.go:14:6
./main.go:13:2:   flow: ~r0 = son:
./main.go:13:2:     from return son (return) at ./main.go:15:2
./main.go:13:2: moved to heap: mom
The compiler clearly tells us that the variable mom has escaped. The cause is that the return value contains a local pointer from within the function. Besides this situation, there are other cases where escape may occur.
::: tips
If you're interested in the details of escape analysis, you can learn more in the standard library cmd/compile/internal/escape/escape.go.
:::
Closure References
When a closure references a variable outside the function, that variable will also escape to the heap. This is easy to understand.
package main

func main() {
  a := make([]string, 0)
  do(func() []string {
    return a
  })
}

func do(f func() []string) []string {
  return f()
}
Output:
$ go build -gcflags="-m -m -l" .
# golearn/example
./main.go:10:9: f does not escape
./main.go:4:2: main capturing by value: a (addr=false assign=false width=24)
./main.go:4:11: make([]string, 0) escapes to heap:
./main.go:4:11:   flow: a = &{storage for make([]string, 0)}:
./main.go:4:11:     from make([]string, 0) (spill) at ./main.go:4:11
./main.go:4:11:     from a := make([]string, 0) (assign) at ./main.go:4:4
./main.go:4:11:   flow: ~r0 = a:
./main.go:4:11:     from return a (return) at ./main.go:6:3
./main.go:4:11: make([]string, 0) escapes to heap
./main.go:5:5: func literal does not escape
Insufficient Space
When stack space is insufficient, escape will also occur. The slice created below requests a capacity of 1<<15:
package main

func main() {
  _ = make([]int, 0, 1<<15)
}
Output:
$ go build -gcflags="-m -m -l" .
# golearn/example
./main.go:4:10: make([]int, 0, 32768) escapes to heap:
./main.go:4:10:   flow: {heap} = &{storage for make([]int, 0, 32768)}:
./main.go:4:10:     from make([]int, 0, 32768) (too large for stack) at ./main.go:4:10
./main.go:4:10: make([]int, 0, 32768) escapes to heap
Unknown Length
When the length of a slice is a variable, since its length is unknown, escape will occur (maps don't have this issue):
package main

func main() {
  n := 100
  _ = make([]int, n)
}
Output:
$ go build -gcflags="-m -m -l" .
# golearn/example
./main.go:5:10: make([]int, n) escapes to heap:
./main.go:5:10:   flow: {heap} = &{storage for make([]int, n)}:
./main.go:5:10:     from make([]int, n) (non-constant size) at ./main.go:5:10
./main.go:5:10: make([]int, n) escapes to heap
There's also a special case where function parameters of type ...any may also cause escape:
package main

import "fmt"

func main() {
  n := 100
  fmt.Println(n)
}
Output:
$ go build -gcflags="-m -m -l" .
# golearn/example
./main.go:7:14: n escapes to heap:
./main.go:7:14:   flow: {storage for ... argument} = &{storage for n}:
./main.go:7:14:     from n (spill) at ./main.go:7:14
./main.go:7:14:     from ... argument (slice-literal-element) at ./main.go:7:13
./main.go:7:14:   flow: {heap} = {storage for ... argument}:
./main.go:7:14:     from ... argument (spill) at ./main.go:7:13
./main.go:7:14:     from fmt.Println(... argument...) (call parameter) at ./main.go:7:13
./main.go:7:13: ... argument does not escape
./main.go:7:14: n escapes to heap
The reason we perform escape analysis and control memory allocation so finely is mainly to reduce GC pressure. However, Go is not C language, and the final decision on memory allocation is still in the hands of the compiler. Except for extreme performance requirements, most of the time we don't need to focus too much on memory allocation details. After all, the purpose of GC is to liberate developers.
Small Detail
For some reference types, when you're sure you won't use them again, you can set them to nil to tell GC it can reclaim them.
type Writer struct {
  buf []byte
}

func (w Writer) Close() error {
  w.buff = nil
  return nil
}
pprof
pprof (program profiling) is a powerful tool for program performance analysis. It samples some of the program's runtime data, covering CPU, memory, goroutines, locks, stack information, and many other aspects, then uses tools to analyze the sampled data and display results.
So using pprof has only two steps:
- Collect data
- Analyze results
Collection
There are two ways to collect data: automatic and manual, each with pros and cons. Before that, write a simple function to simulate memory and CPU consumption:
func Do() {
  for i := 0; i < 10; i++ {
    slice := makeSlice()
    sortSlice(slice)
  }
}

func makeSlice() []int {
  var s []int
  for range 1 << 24 {
    s = append(s, rand.Int())
  }
  return s
}

func sortSlice(s []int) {
  slices.Sort(s)
}
Manual
Manual collection is controlled through code. Its advantages are controllable, flexible, and customizable. To use pprof directly in code, you need to import the runtime/pprof package:
package main

import (
  "log"
  "os"
  "runtime/pprof"
)

func main() {
    Do()
  w, _ := os.Create("heap.pb")
  heapProfile := pprof.Lookup("heap")
  err := heapProfile.WriteTo(w, 0)
  if err != nil {
    log.Fatal(err)
  }
}
The parameters supported by pprof.Lookup are shown in the code below:
profiles.m = map[string]*Profile{
    "goroutine":    goroutineProfile,
    "threadcreate": threadcreateProfile,
    "heap":         heapProfile,
    "allocs":       allocsProfile,
    "block":        blockProfile,
    "mutex":        mutexProfile,
}
This function writes the collected data to the specified file. The number passed when writing has the following meanings:
0, write compressed Protobuf data, not readable1, write text format data, readable, this is what HTTP interface returns2, only available forgoroutine, means printingpanicstyle stack information
Collecting CPU data requires using the pprof.StartCPUProfile function separately. It needs some time for sampling, and its raw data is not readable, as shown below:
package main

import (
  "log"
  "os"
  "runtime/pprof"
  "time"
)

func main() {
    Do()
  w, _ := os.Create("cpu.out")
  err := pprof.StartCPUProfile(w)
  if err != nil {
    log.Fatal(err)
  }
  time.Sleep(time.Second * 10)
  pprof.StopCPUProfile()
}
Collecting trace data is the same:
package main

import (
  "log"
  "os"
  "runtime/trace"
  "time"
)

func main() {
    Do()
  w, _ := os.Create("trace.out")
  err := trace.Start(w)
  if err != nil {
    log.Fatal(err)
  }
  time.Sleep(time.Second * 10)
  trace.Stop()
}
Automatic
The net/http/pprof package wraps the above analysis functions into HTTP interfaces and registers them to the default router, as shown below:
package pprof

import ...

func init() {
    http.HandleFunc("/debug/pprof/", Index)
    http.HandleFunc("/debug/pprof/cmdline", Cmdline)
    http.HandleFunc("/debug/pprof/profile", Profile)
    http.HandleFunc("/debug/pprof/symbol", Symbol)
    http.HandleFunc("/debug/pprof/trace", Trace)
}
This allows us to run pprof data collection with one click:
package main

import (
  "net/http"
    // Remember to import this package
  _ "net/http/pprof"
)

func main() {
    go func(){
        http.ListenAndServe(":8080", nil)
    }
    for {
        Do()
    }
}
At this point, open the browser and visit http://127.0.0.1:8080/debug/pprof, and a page like this will appear:

There are several options to choose from on the page, they represent:
allocs: Memory allocation samplingblock: Blocking tracking for synchronization primitivescmdline: Current program's command line invocationgoroutine: Track all goroutinesheap: Memory allocation sampling for live objectsmutex: Mutex-related information trackingprofile: CPU analysis, will analyze for a period and download a filethreadcreate: Analyze causes of new OS thread creationtrace: Current program execution tracking, also downloads a file
Most of the data here is not very readable, mainly for tools to analyze, as shown below:
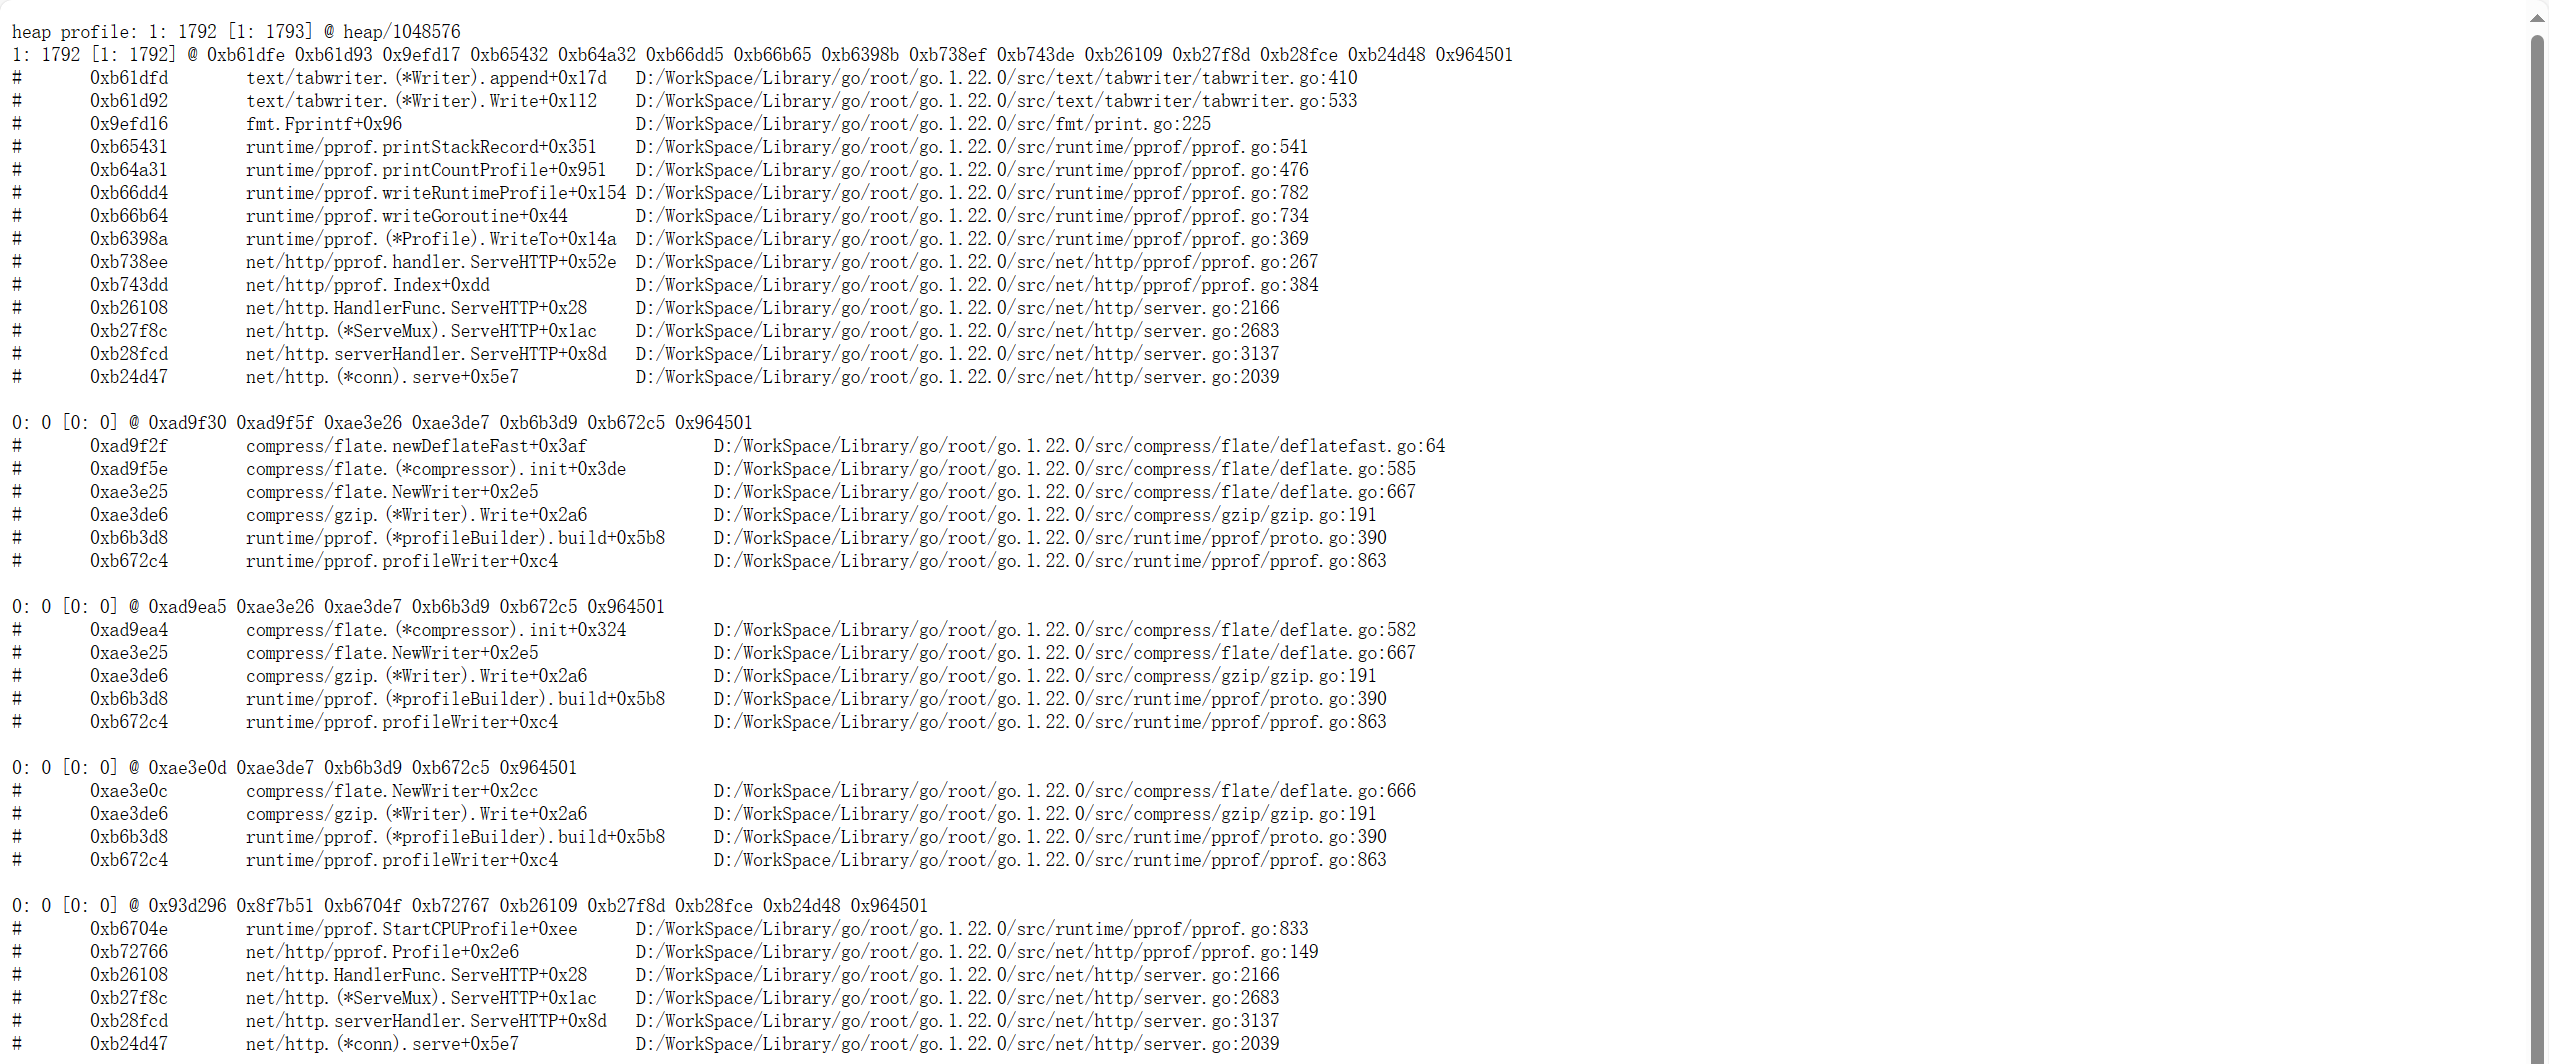
The specific analysis work will be done later. Except for profile and trace options, if you want to download data files in the web page, you can remove the debug=1 query parameter. You can also integrate these interfaces into your own router instead of using the default router, as shown below:
package main

import (
  "net/http"
  "net/http/pprof"
)

func main() {
  mux := http.NewServeMux()
  mux.HandleFunc("/trace", pprof.Trace)
  servre := &http.Server{
    Addr:    ":8080",
    Handler: mux,
  }
  servre.ListenAndServe()
}
This way, you can also integrate it into other web frameworks, such as gin, iris, etc.
Analysis
After obtaining the collected data files, there are two ways to analyze: command line or web page. Both require the pprof command line tool, which is integrated by default in Go, so no additional download is needed.
pprof open source address: google/pprof: pprof is a tool for visualization and analysis of profiling data (github.com)
Command Line
Use the previously collected data file as a parameter:
$ go tool pprof heap.pbIf the data is collected by web, replace the filename with a web URL:
$ go tool pprof -http :8080 http://127.0.0.1/debug/pprof/heapThen an interactive command line will appear:
15:27:38.3266862 +0800 CST
Type: inuse_space
Time: Apr 15, 2024 at 3:27pm (CST)
No samples were found with the default sample value type.
Try "sample_index" command to analyze different sample values.
Entering interactive mode (type "help" for commands, "o" for options)
(pprof)
Type help to see other commands:
  Commands:
    callgrind        Outputs a graph in callgrind format
    comments         Output all profile comments
    disasm           Output assembly listings annotated with samples
    dot              Outputs a graph in DOT format
    eog              Visualize graph through eog
    evince           Visualize graph through evince
  ...
In the command line, the top command is generally used to view data. You can also use the traces command, but its output is very long. The top command just gives a simple overview:
(pprof) top 5
Showing nodes accounting for 117.49MB, 100% of 117.49MB total
      flat  flat%   sum%        cum   cum%
  117.49MB   100%   100%   117.49MB   100%  main.makeSlice (inline)
         0     0%   100%   117.49MB   100%  main.Do
         0     0%   100%   117.49MB   100%  main.main
         0     0%   100%   117.49MB   100%  runtime.main
Brief introduction to some of the indicators (same for CPU):
flat, represents the resources consumed by the current functioncum, the sum of resources consumed by the current function and its subsequent call chainflat%, flat/totalcum%, cum/total
We can clearly see that the memory usage of the entire call stack is 117.49MB. Since the Do function itself doesn't do anything, just calls other functions, its flat indicator is 0. Creating slices is the responsibility of the makeSlice function, so its flat indicator is 100%.
We can convert to visual formats. pprof supports many formats, such as pdf, svg, png, gif, etc. (requires installing Graphviz).
(pprof) png
Generating report in profile001.png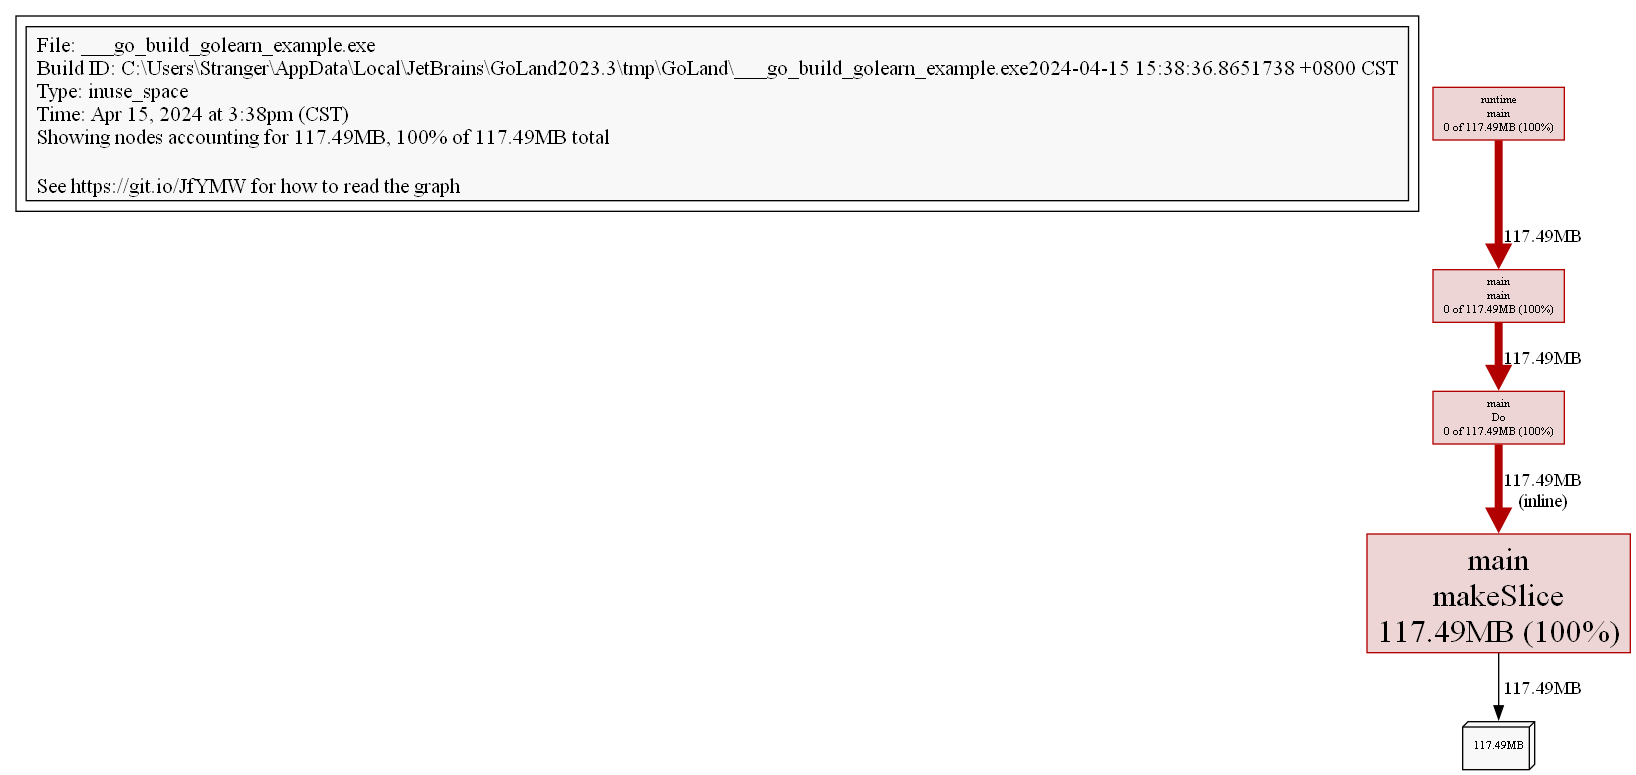
Through the image, we can more clearly see the memory situation of the entire call stack.
View in source code form through the list command:
(pprof) list Do
Total: 117.49MB
ROUTINE ======================== main.Do in D:\WorkSpace\Code\GoLeran\golearn\example\main.go
         0   117.49MB (flat, cum)   100% of Total
         .          .     21:func Do() {
         .          .     22:   for i := 0; i < 10; i++ {
         .   117.49MB     23:           slice := makeSlice()
         .          .     24:           sortSlice(slice)
         .          .     25:   }
         .          .     26:}
         .          .     27:
         .          .     28:func makeSlice() []int {
For images and source code, you can also use web and weblist commands to view images and source code in the browser.
Web Page
Before this, to make the data more diverse, modify the simulation function:
func Do1() {
  for i := 0; i < 10; i++ {
    slice := makeSlice()
    sortSlice(slice)
  }
}

func Do2() {
  for i := 0; i < 10; i++ {
    slice := makeSlice()
    sortSlice(slice)
  }
}

func makeSlice() []int {
  var s []int
  for range 1 << 12 {
    s = append(s, rand.Int())
  }
  return s
}

func sortSlice(s []int) {
  slices.Sort(s)
}
Web analysis can visualize results, saving us from manual command line operations. When using web analysis, just execute the following command:
$ go tool pprof -http :8080 heap.pbIf the data is collected by web, replace the filename with a web URL:
$ go tool pprof -http :8080 http://127.0.0.1:9090/debug/pprof/heap
$ go tool pprof -http :8080 http://127.0.0.1:9090/debug/pprof/profile
$ go tool pprof -http :8080 http://127.0.0.1:9090/debug/pprof/goroutine
TIP
For how to analyze data, go to pprof: How to read the graph to learn more
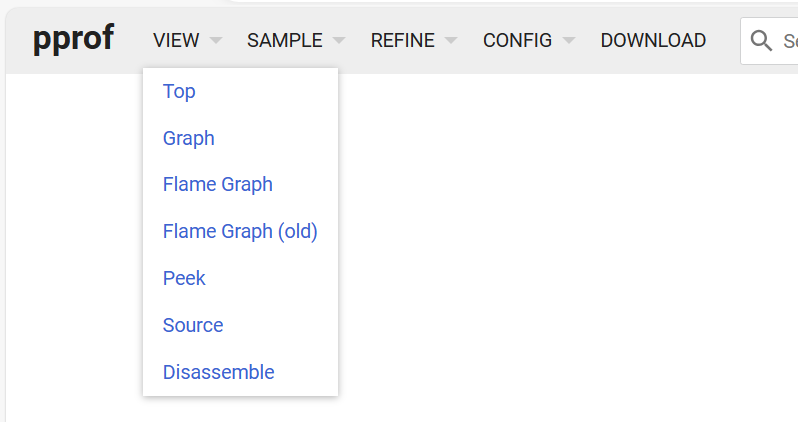
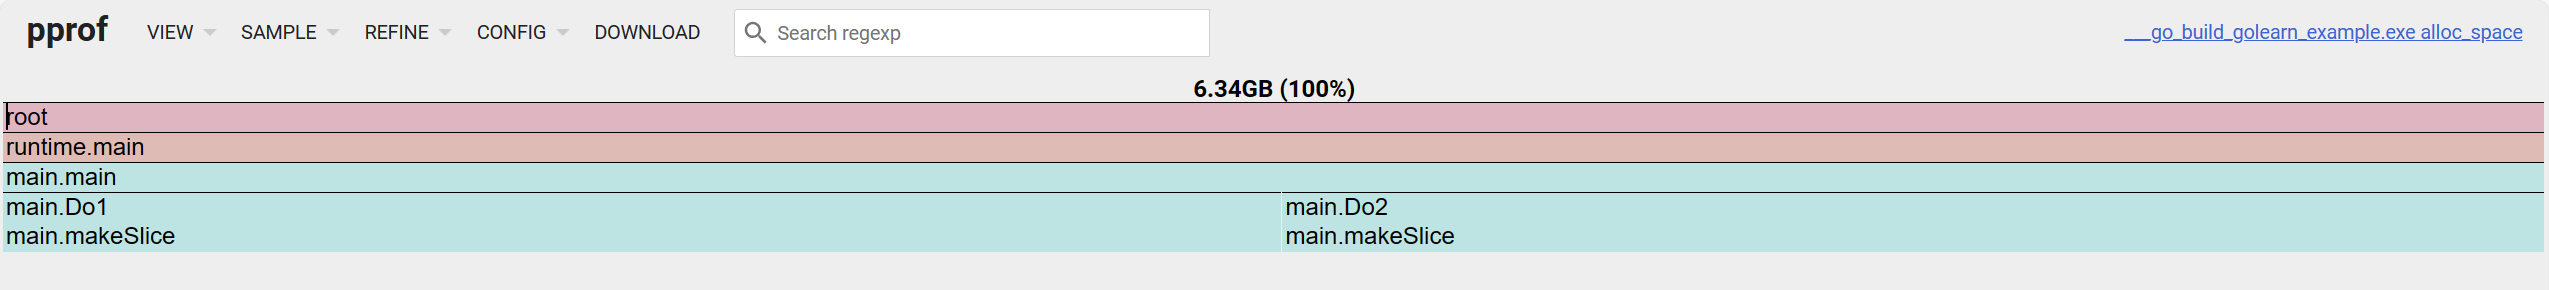
There are 6 items to view on the web page:
- Top, same as command top
- Graph, line graph
- Flame Graph, flame graph
- Peek,
- Source, view source code
- Disassemble, disassembly view
For memory, there are four dimensions to analyze:
alloc_objects: Number of all objects currently allocated, including released onesalloc_space: All memory space allocated so far, including released onesinuse_objects: Number of objects currently in useinuse_space: Memory space currently in use
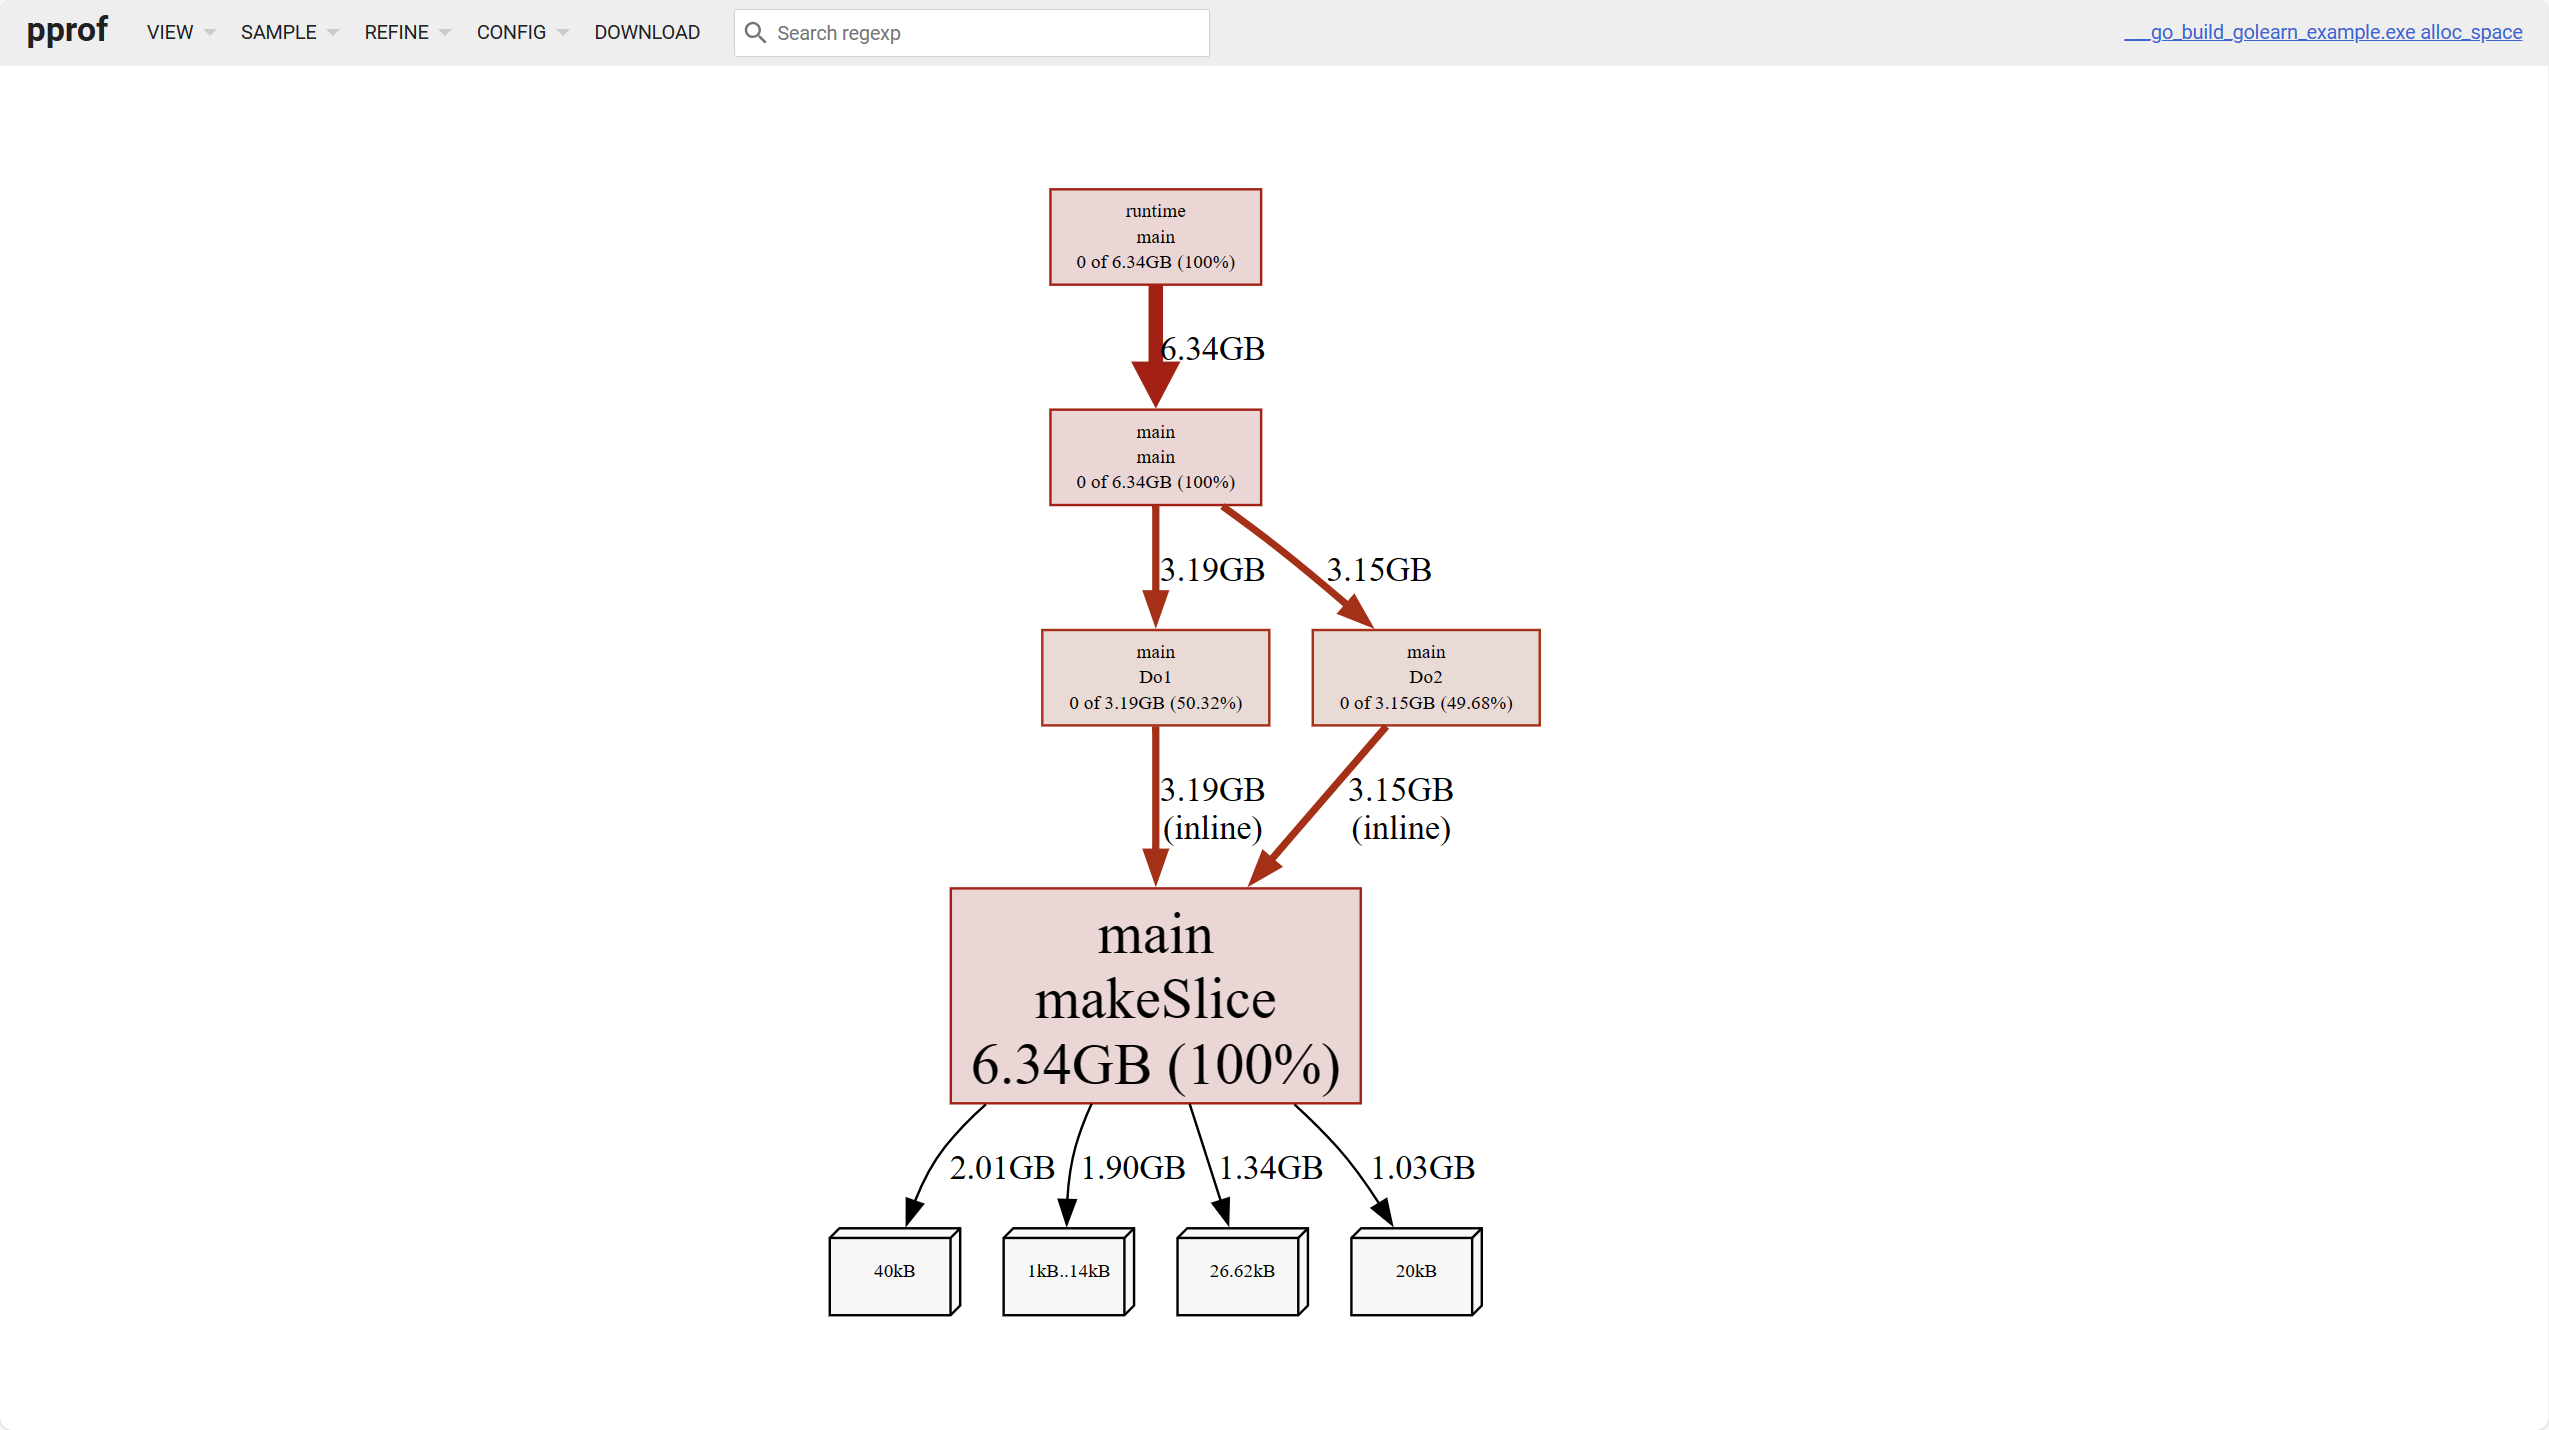
The white leaf nodes at the bottom of the above image represent object occupation of different sizes.
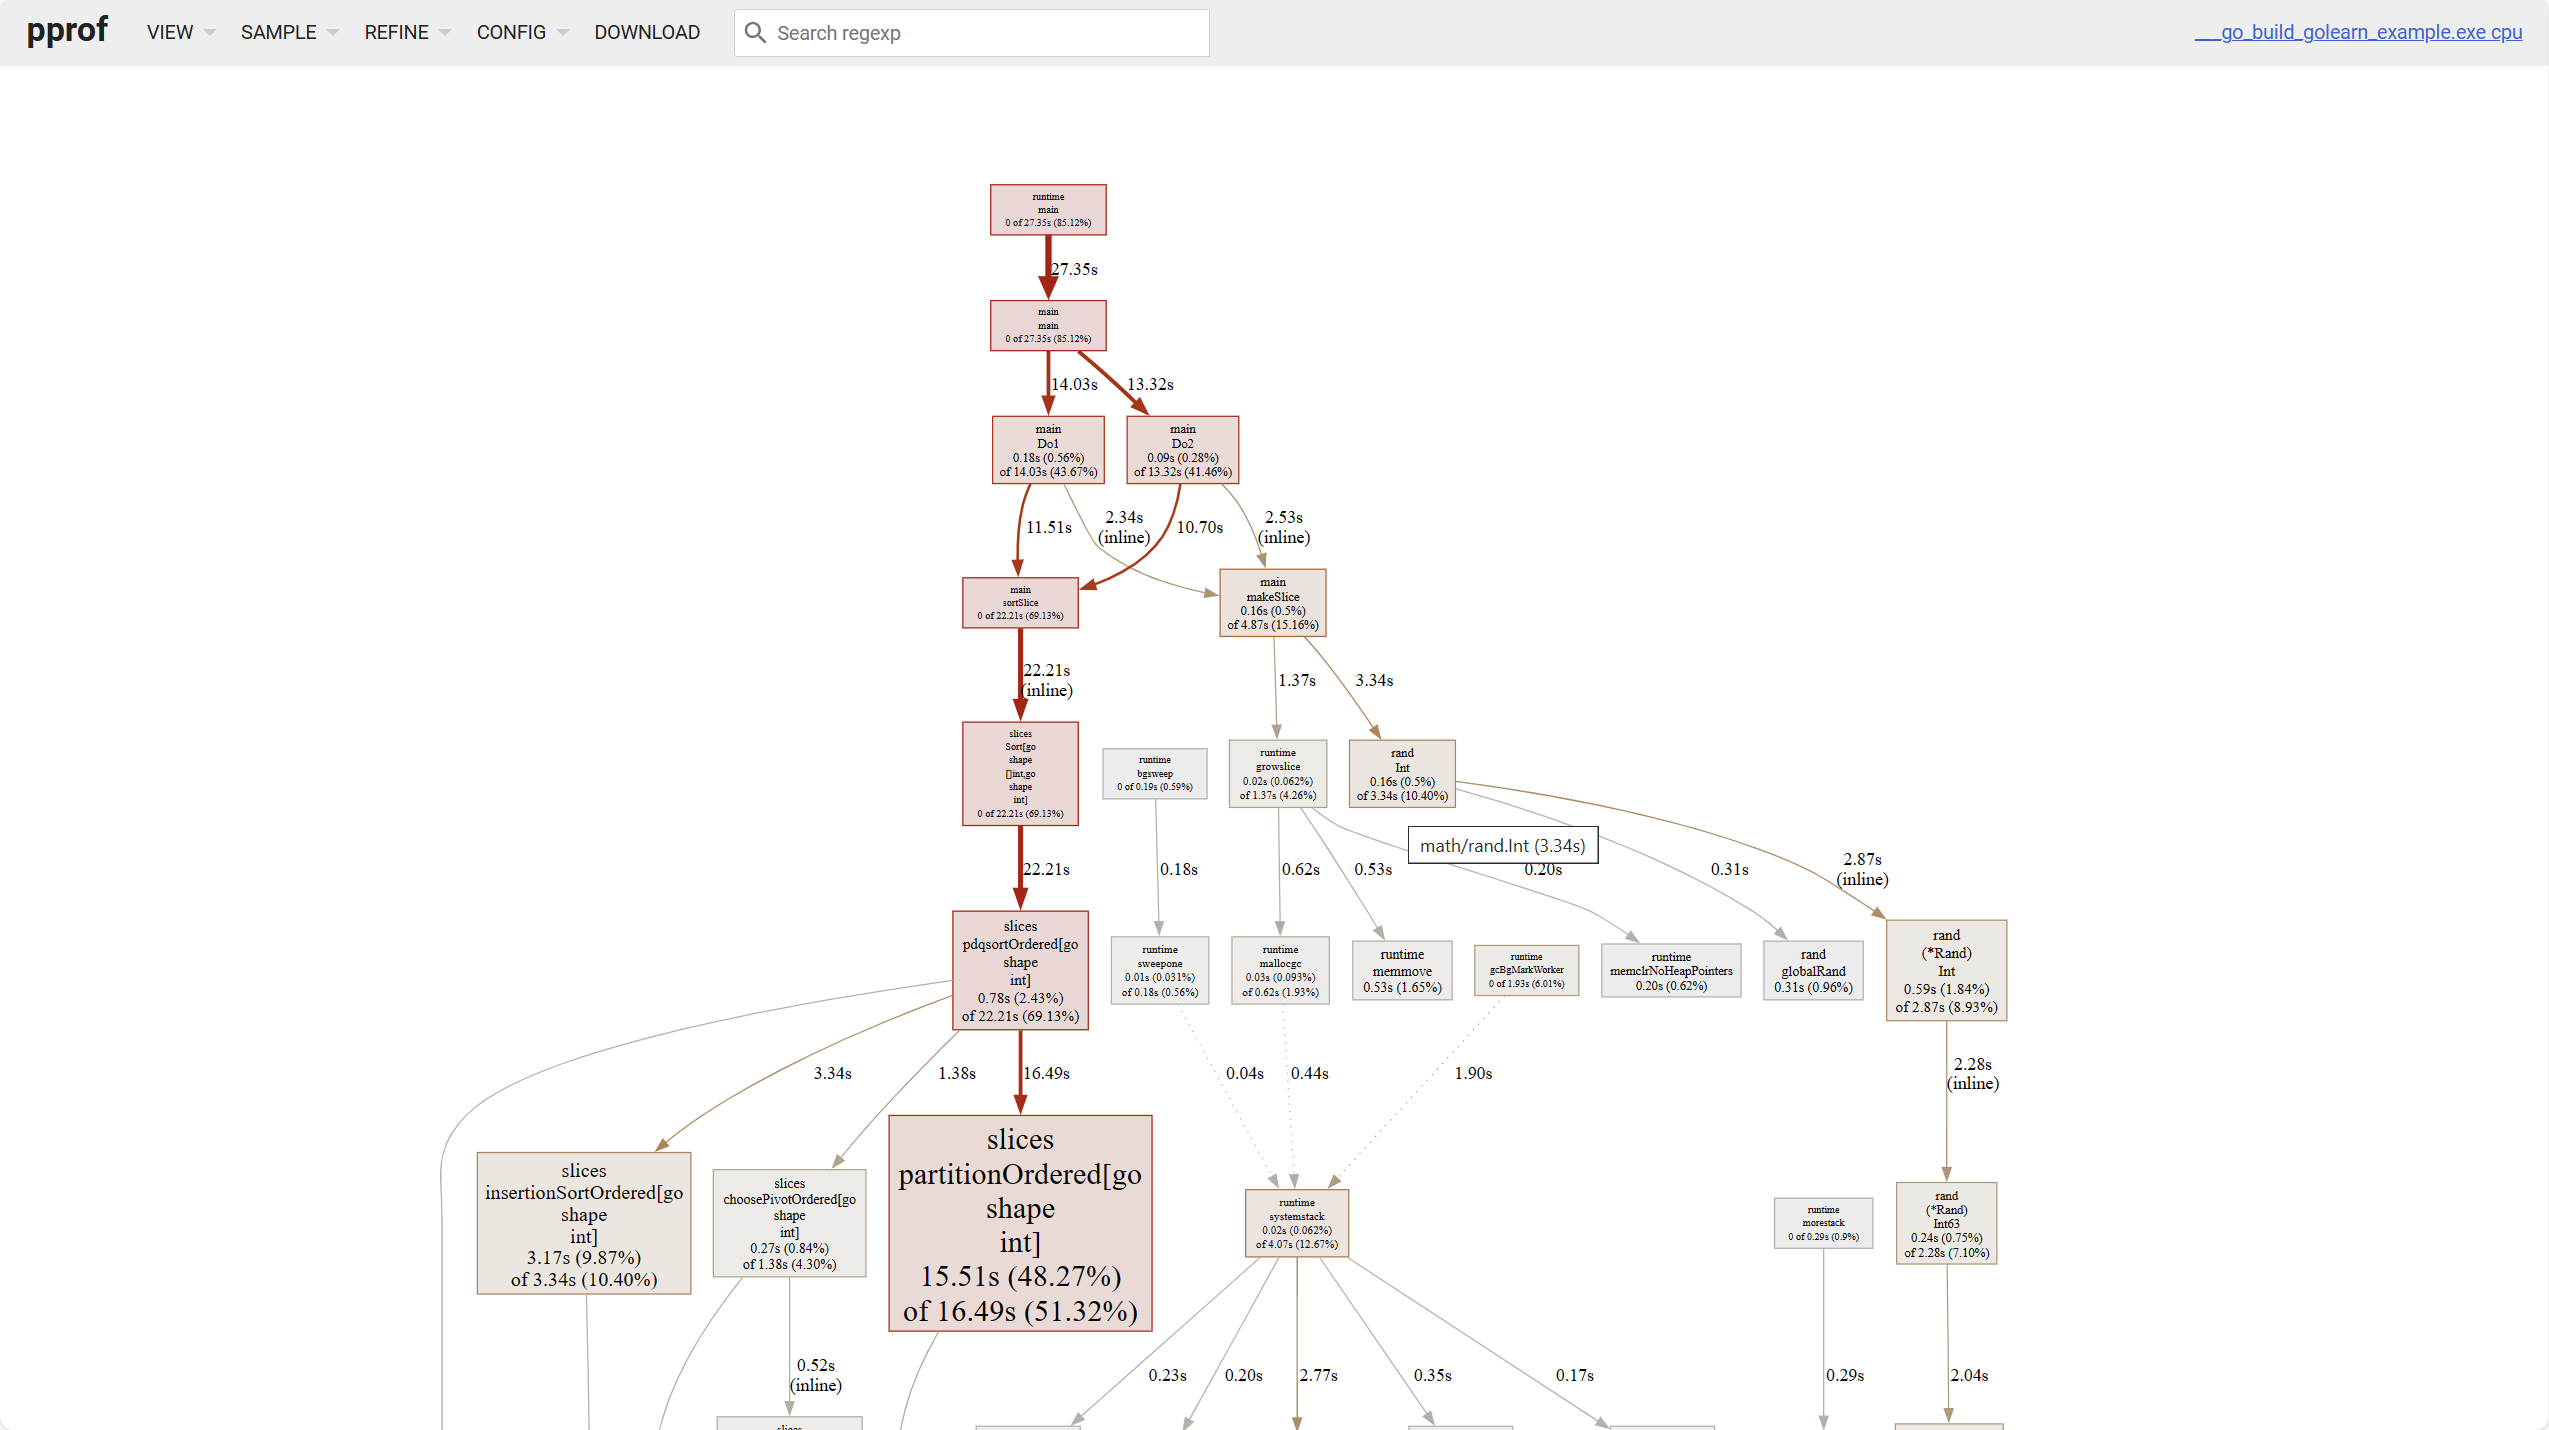
For line graphs, there are a few points to note:
- The darker the block color, the higher the occupation; the thicker the line, the higher the occupation
- Solid lines represent direct calls, dashed lines represent some call chains being skipped.
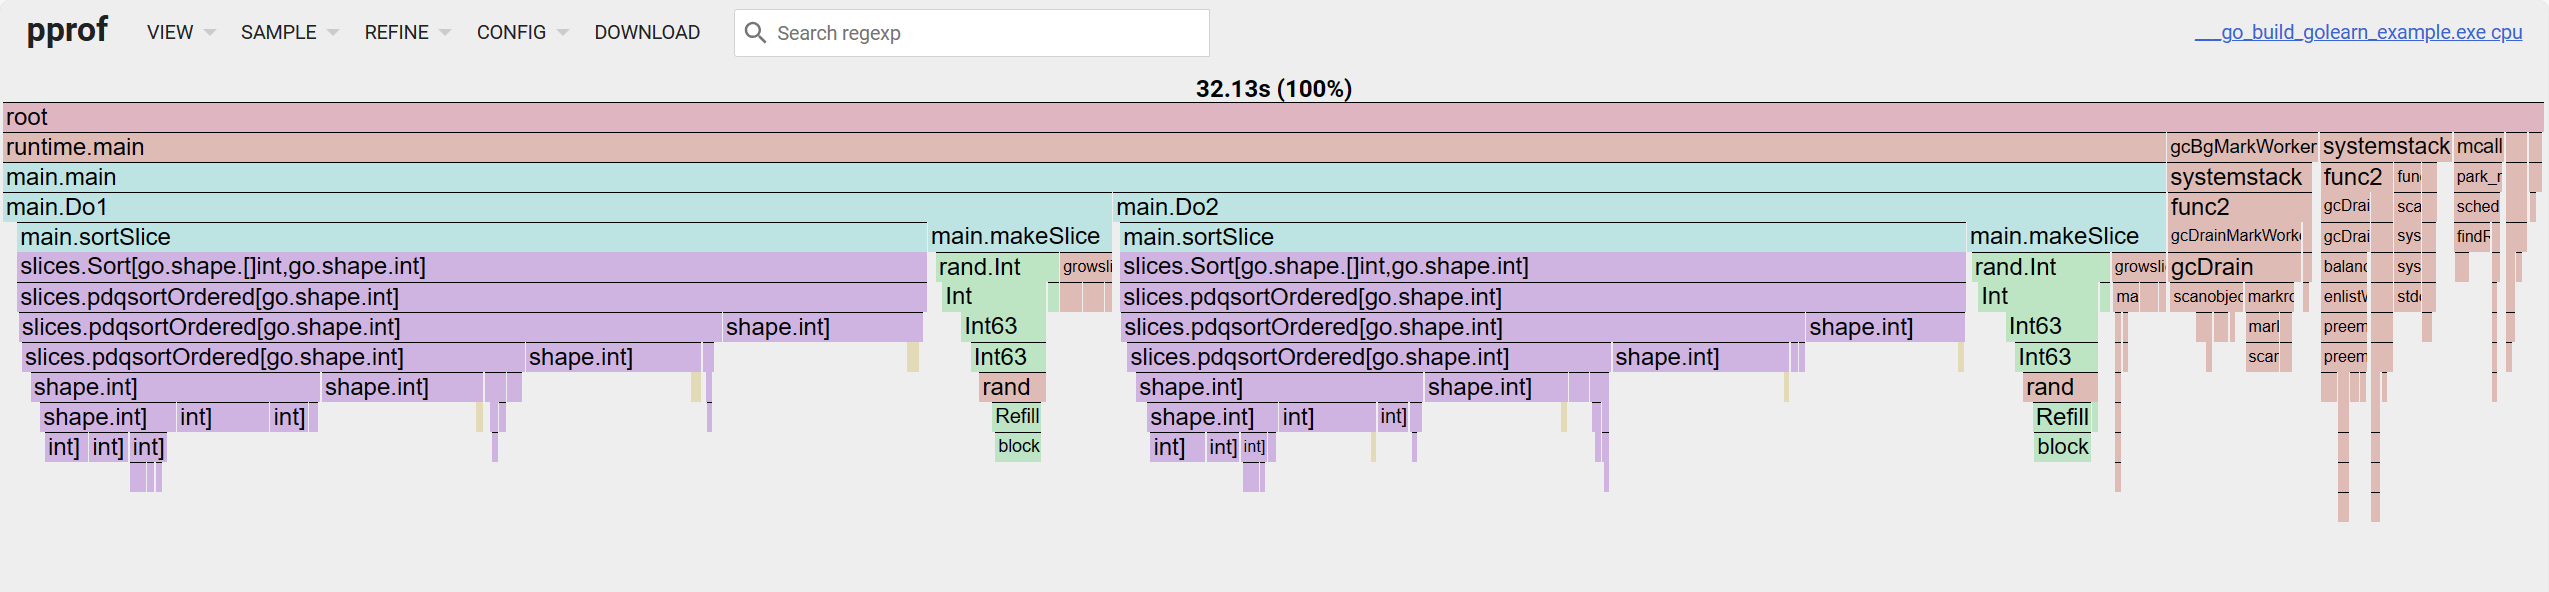
For flame graphs, looking from top to bottom is the call chain, looking from left to right is the cum occupation percentage.
trace
pprof is mainly responsible for analyzing program resource usage, while trace is more suitable for tracking program execution details. Its data files are not compatible with the former, and the go tool trace command is used to complete the related analysis work.
If it's manually collected data, use the filename as a parameter:
$ go tool trace trace.outIf it's automatically collected, it's the same:
$ curl http://127.0.0.1:8080/debug/pprof/trace > trace.out && go tool trace trace.outAfter execution, a web server will start:
2024/04/15 17:15:40 Preparing trace for viewer...
2024/04/15 17:15:40 Splitting trace for viewer...
2024/04/15 17:15:40 Opening browser. Trace viewer is listening on http://127.0.0.1:51805
After opening, the page looks roughly like this:

This mainly contains the following parts. Understanding this data is quite challenging.
Event timelines for running goroutines
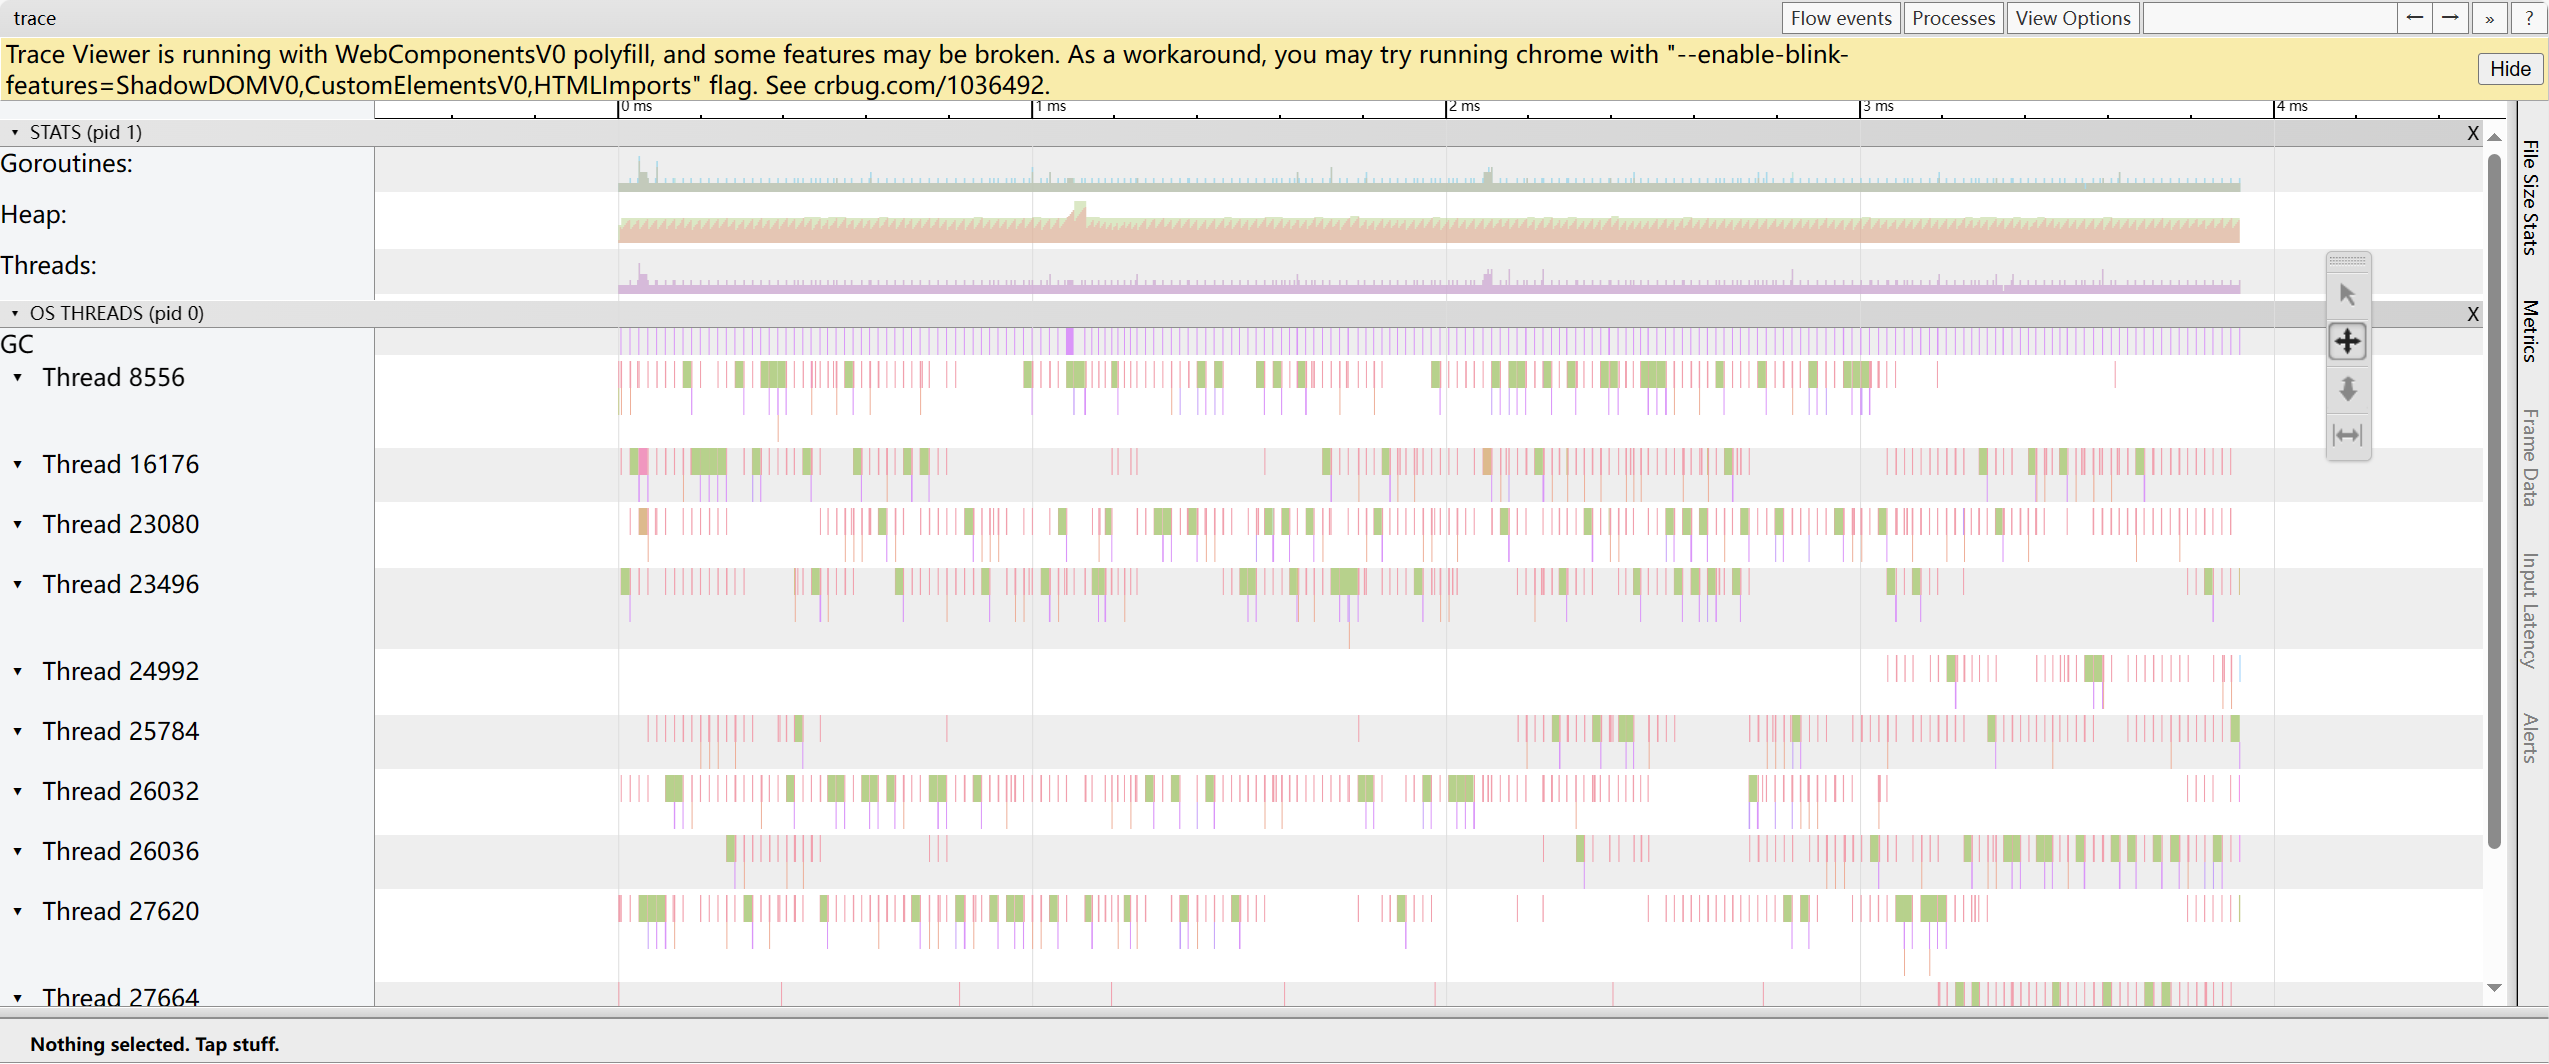
trace by proc: Shows the goroutine timeline running on each processor at each moment
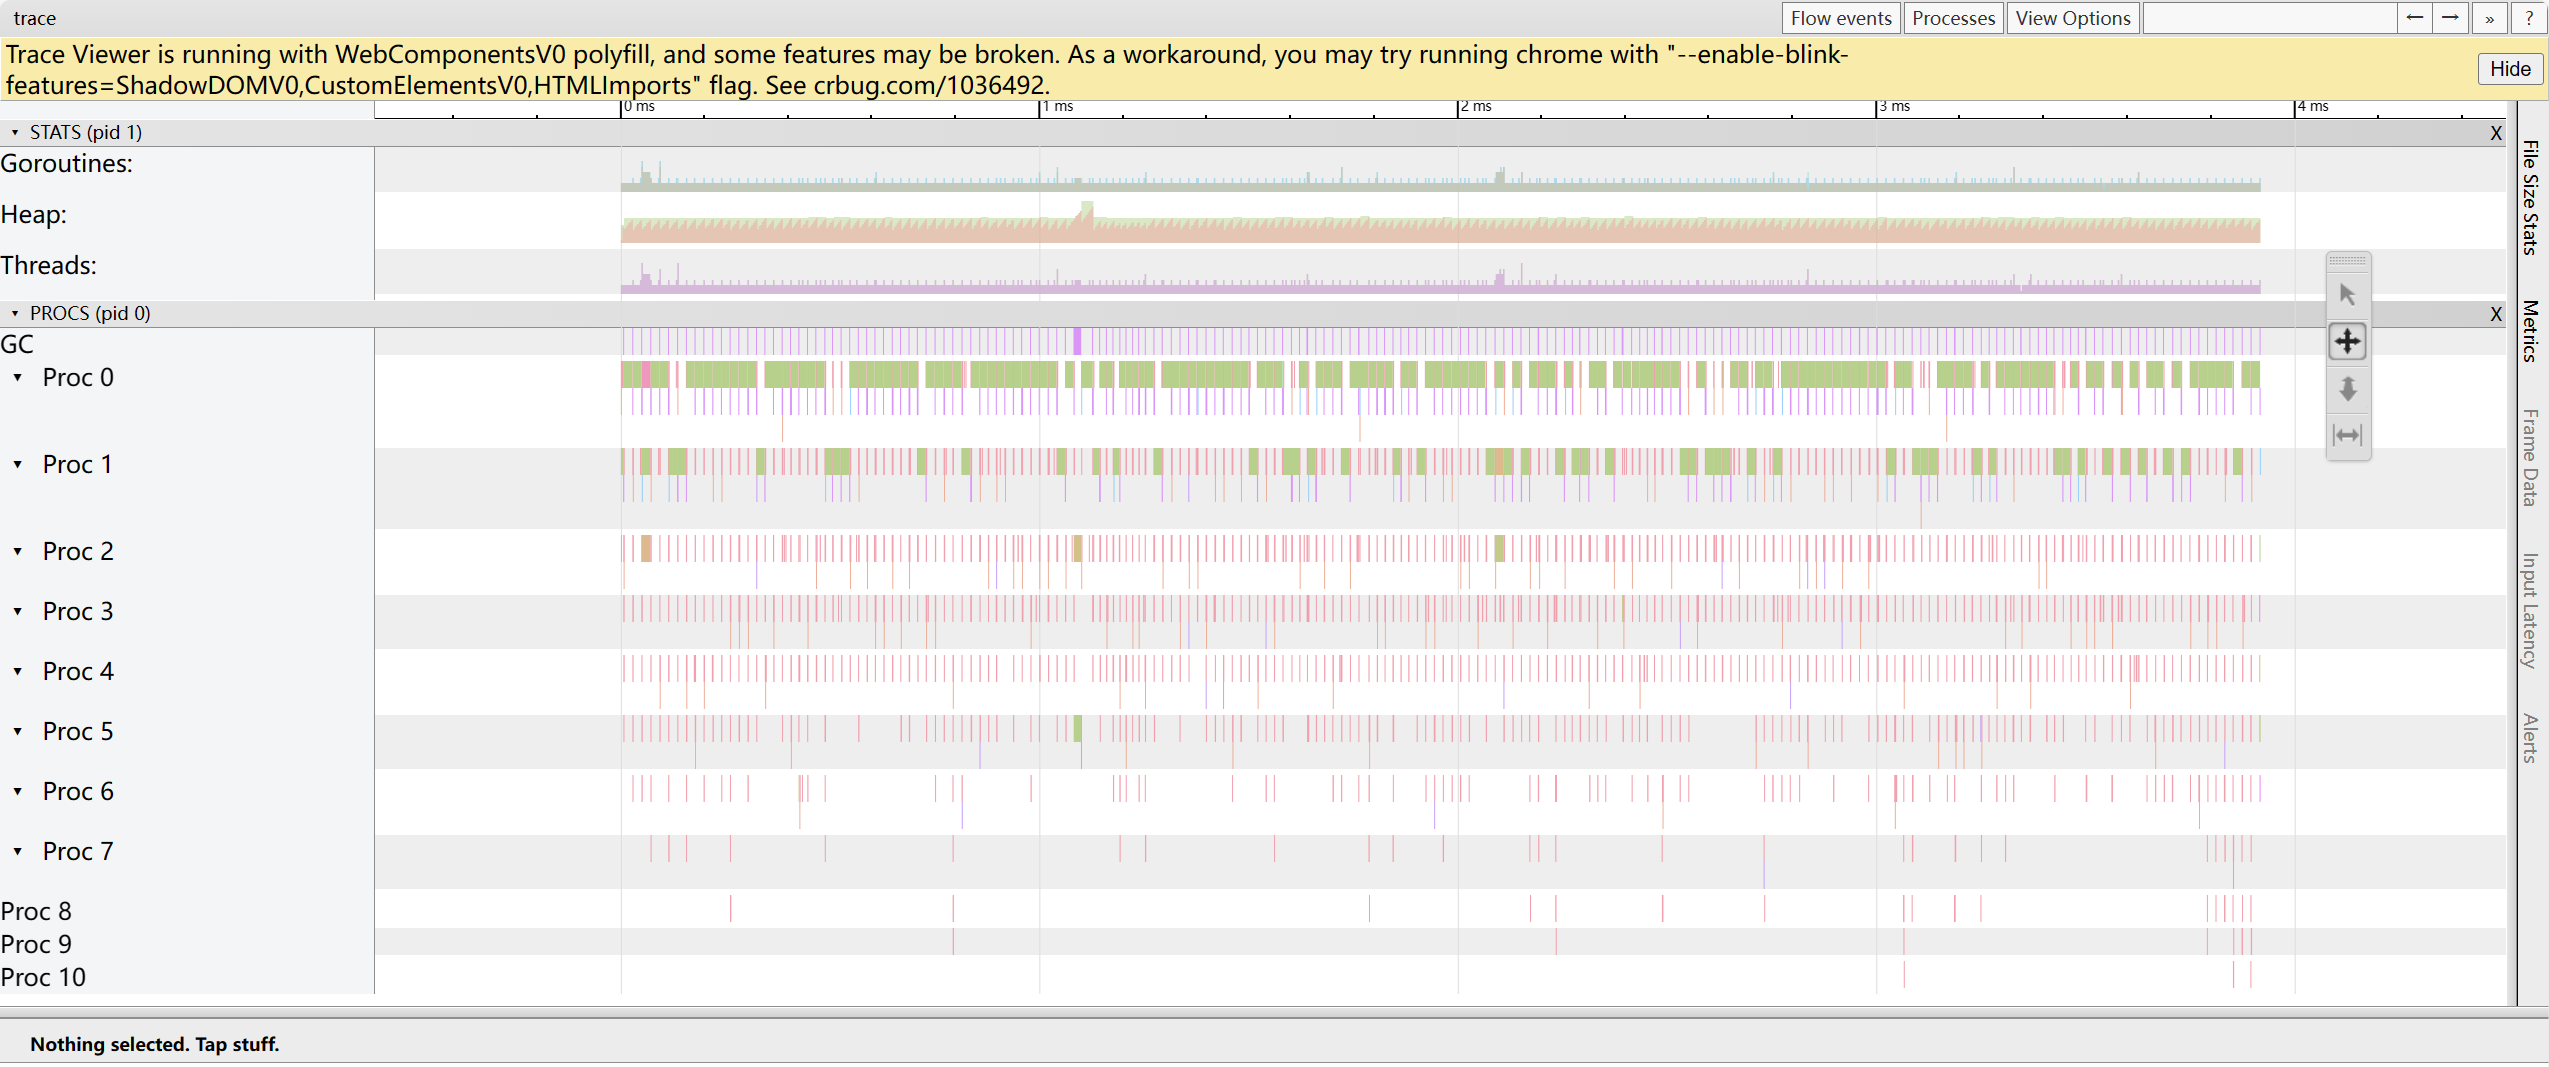
trace by thread: Shows the goroutine timeline running on OS threads at each moment
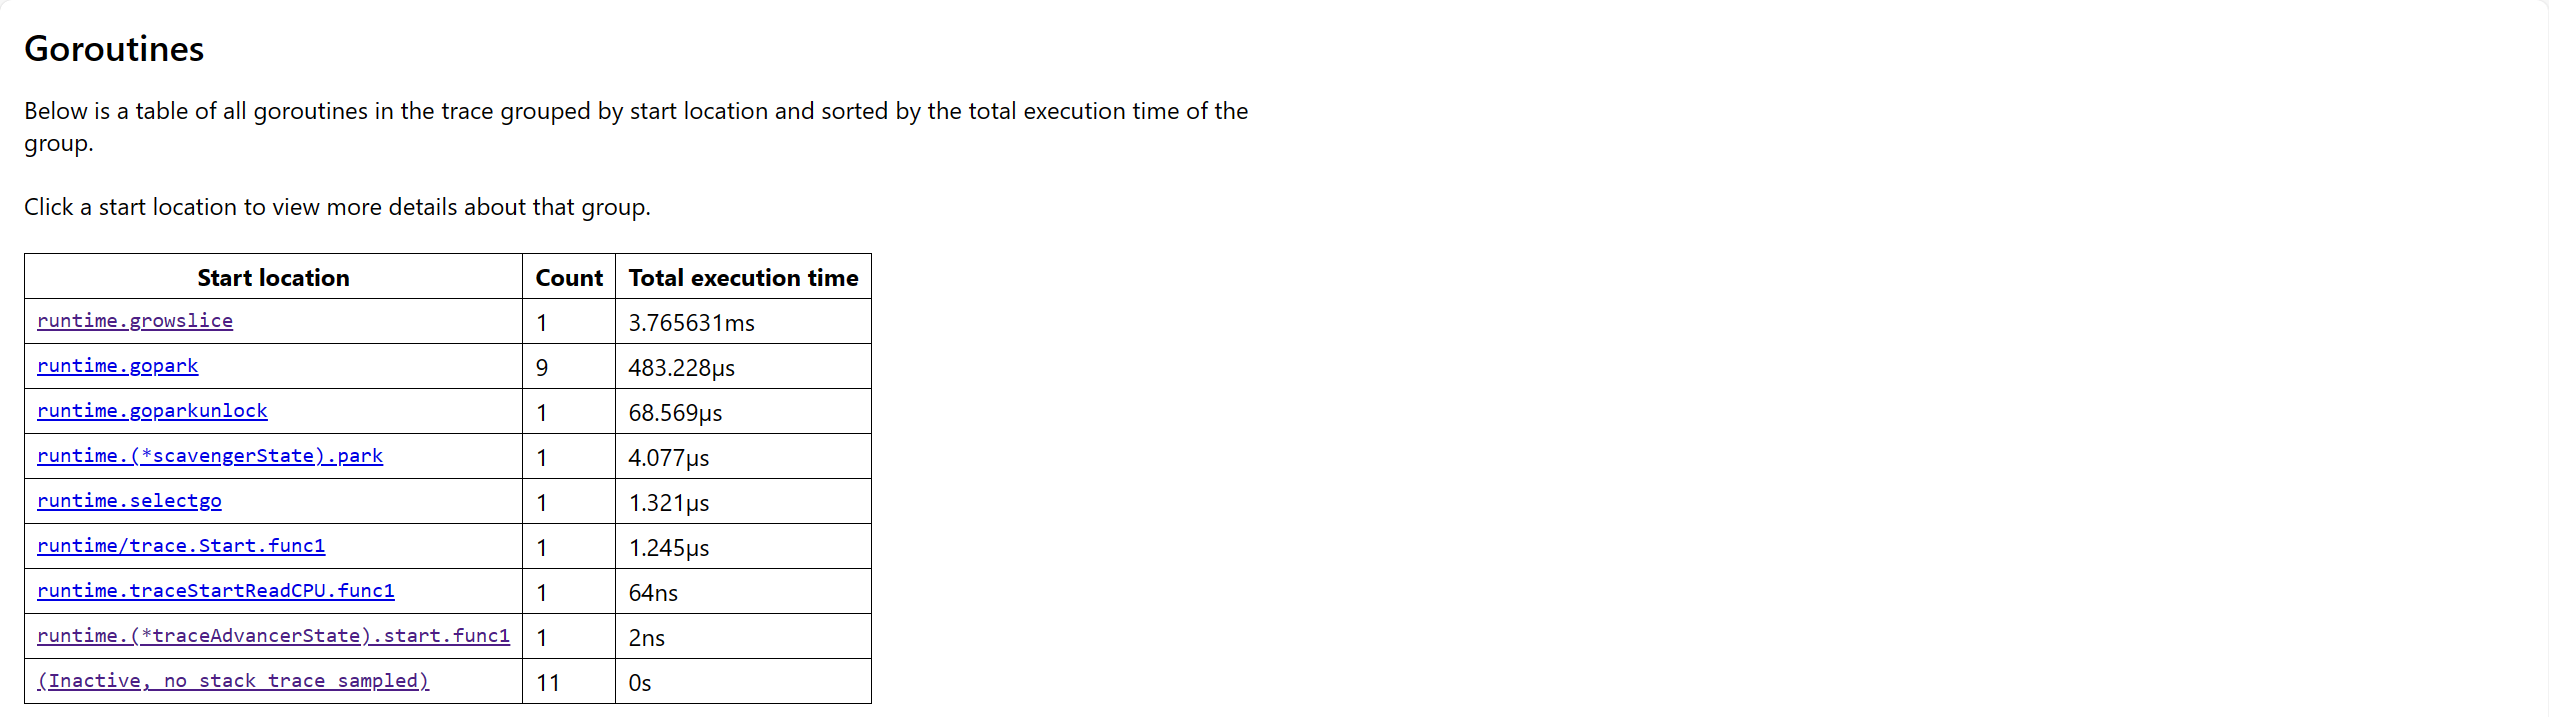
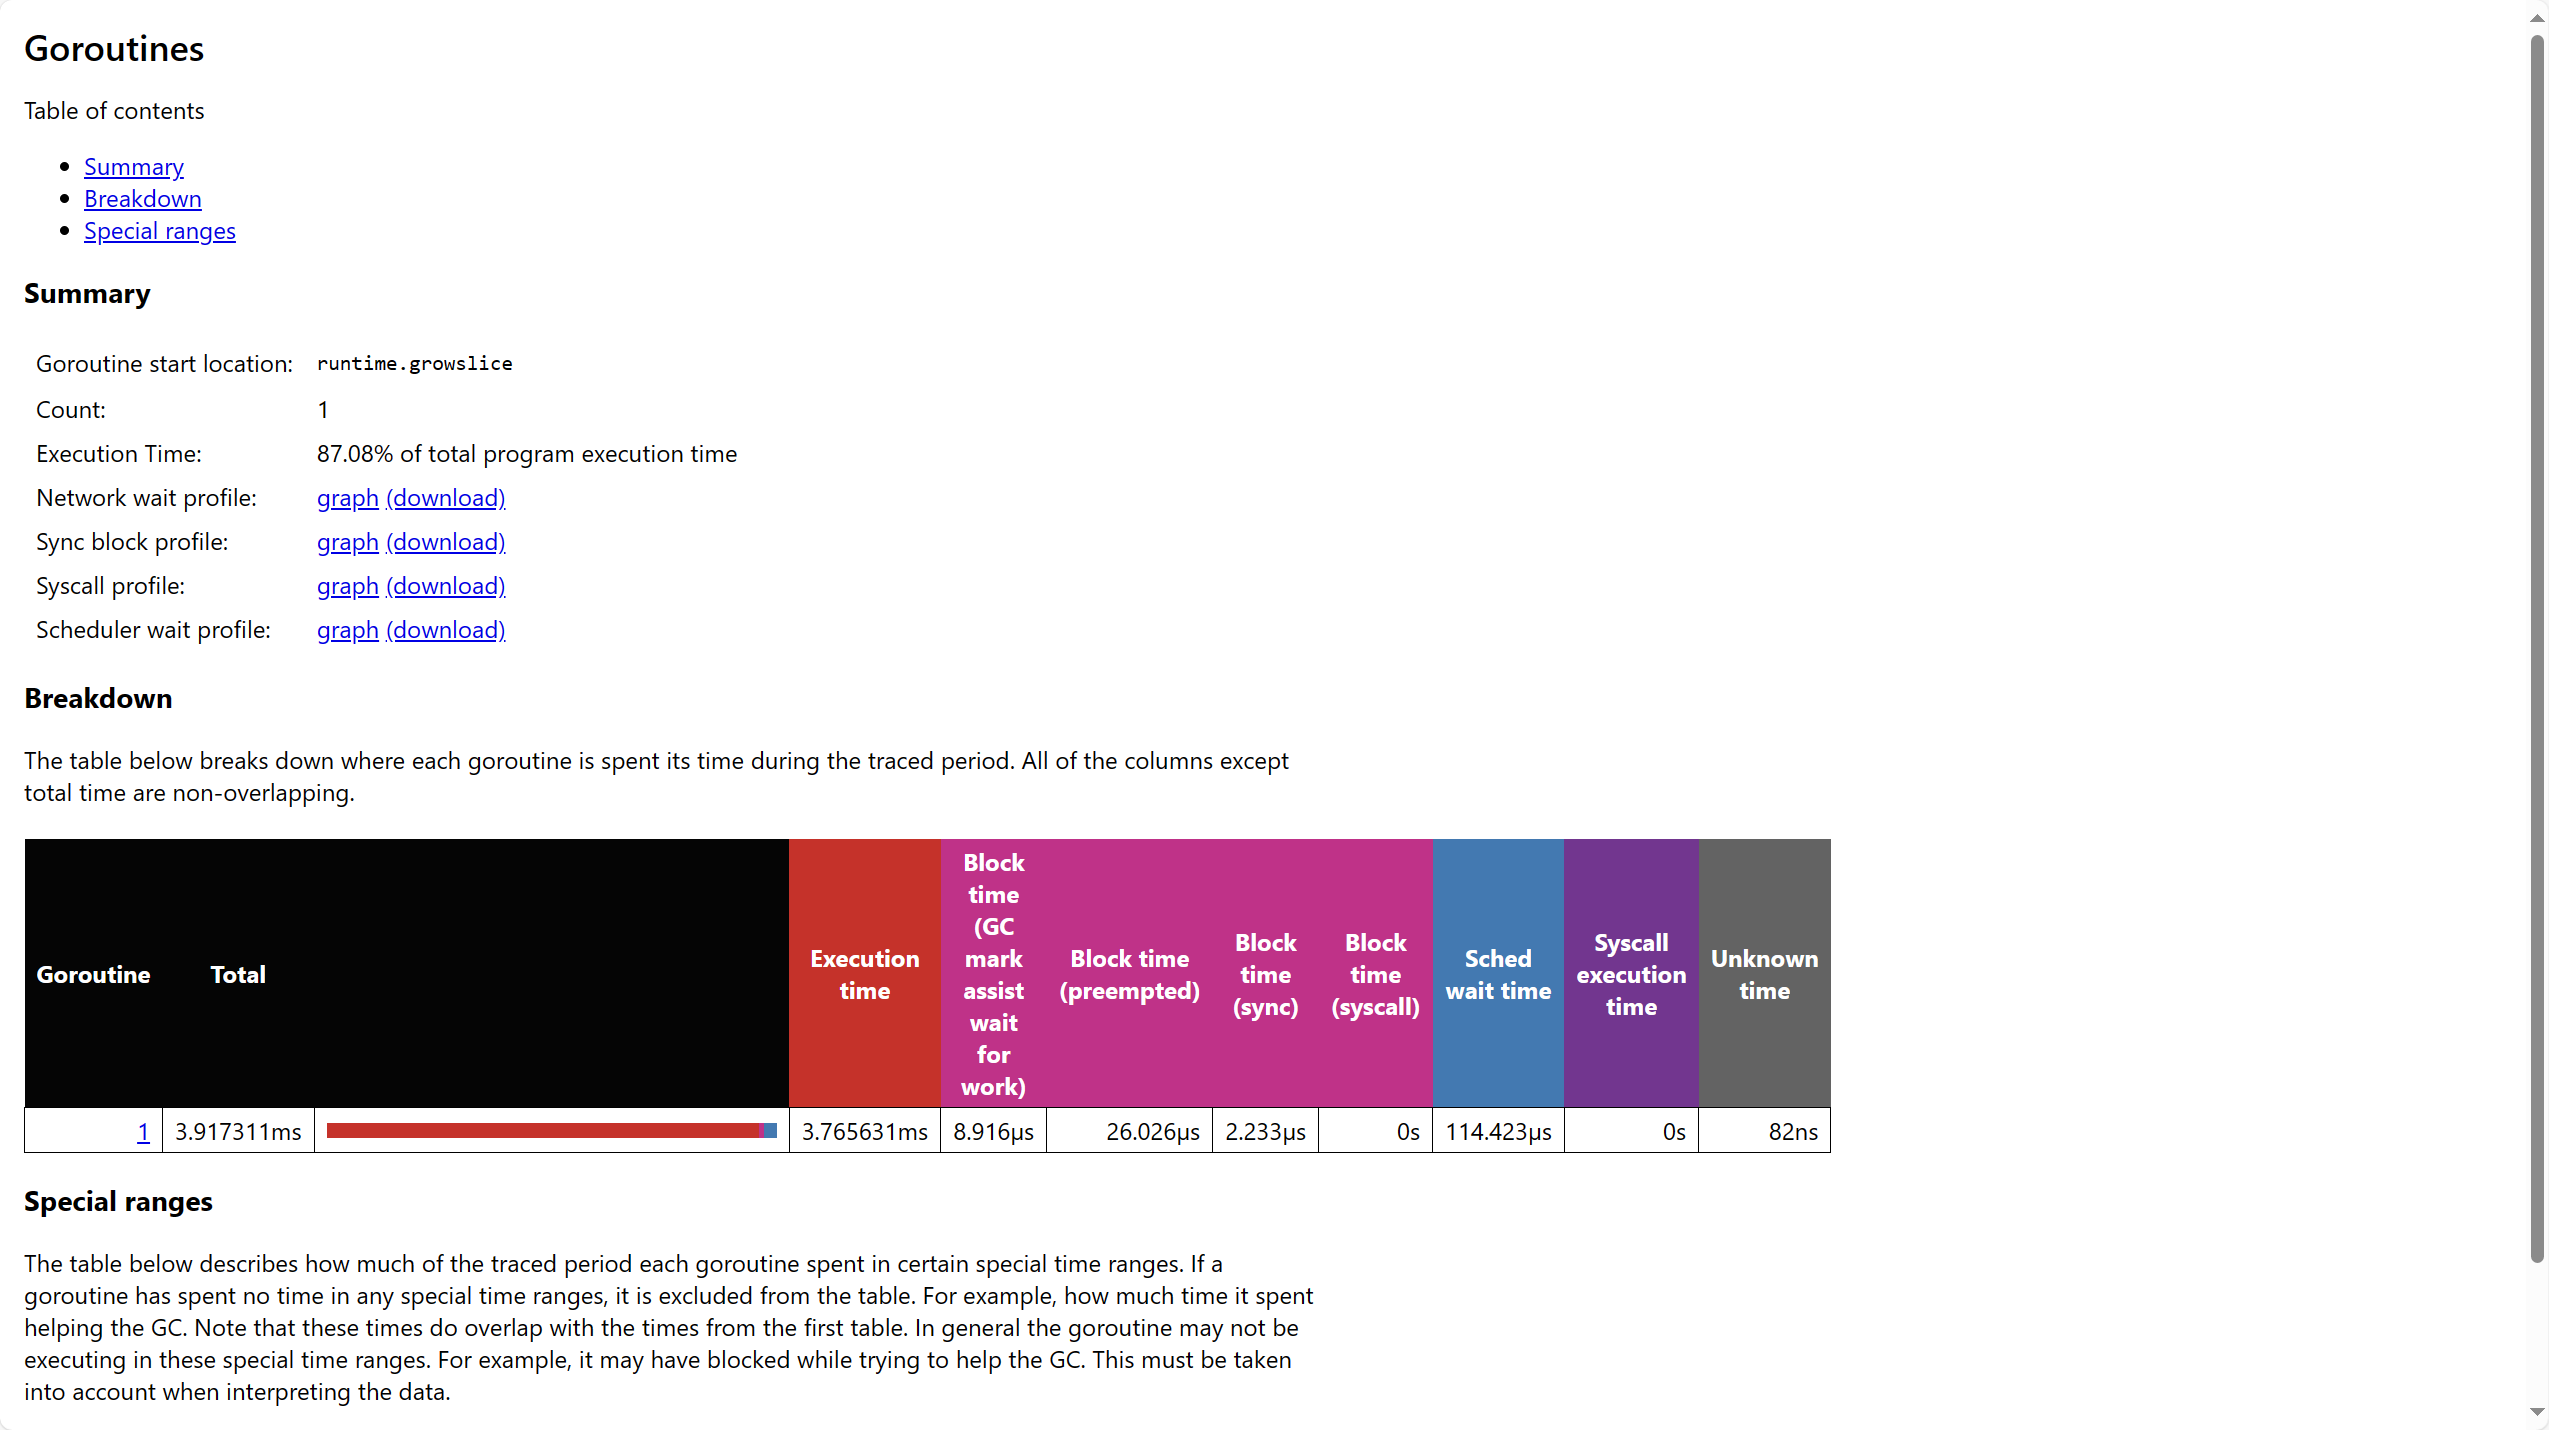
Goroutine analysis: Shows statistics related to goroutines for each group of main functions
Profiles
- Network blocking profile: Goroutine information blocked due to network IO
- Synchronization blocking profile: Goroutine information blocked due to synchronization primitives
- Syscall profile: Goroutine information blocked due to system calls
User-defined tasks and regions
- User-defined tasks: Goroutine information related to user-defined tasks
- User-defined regions: Goroutine information related to user-defined code regions
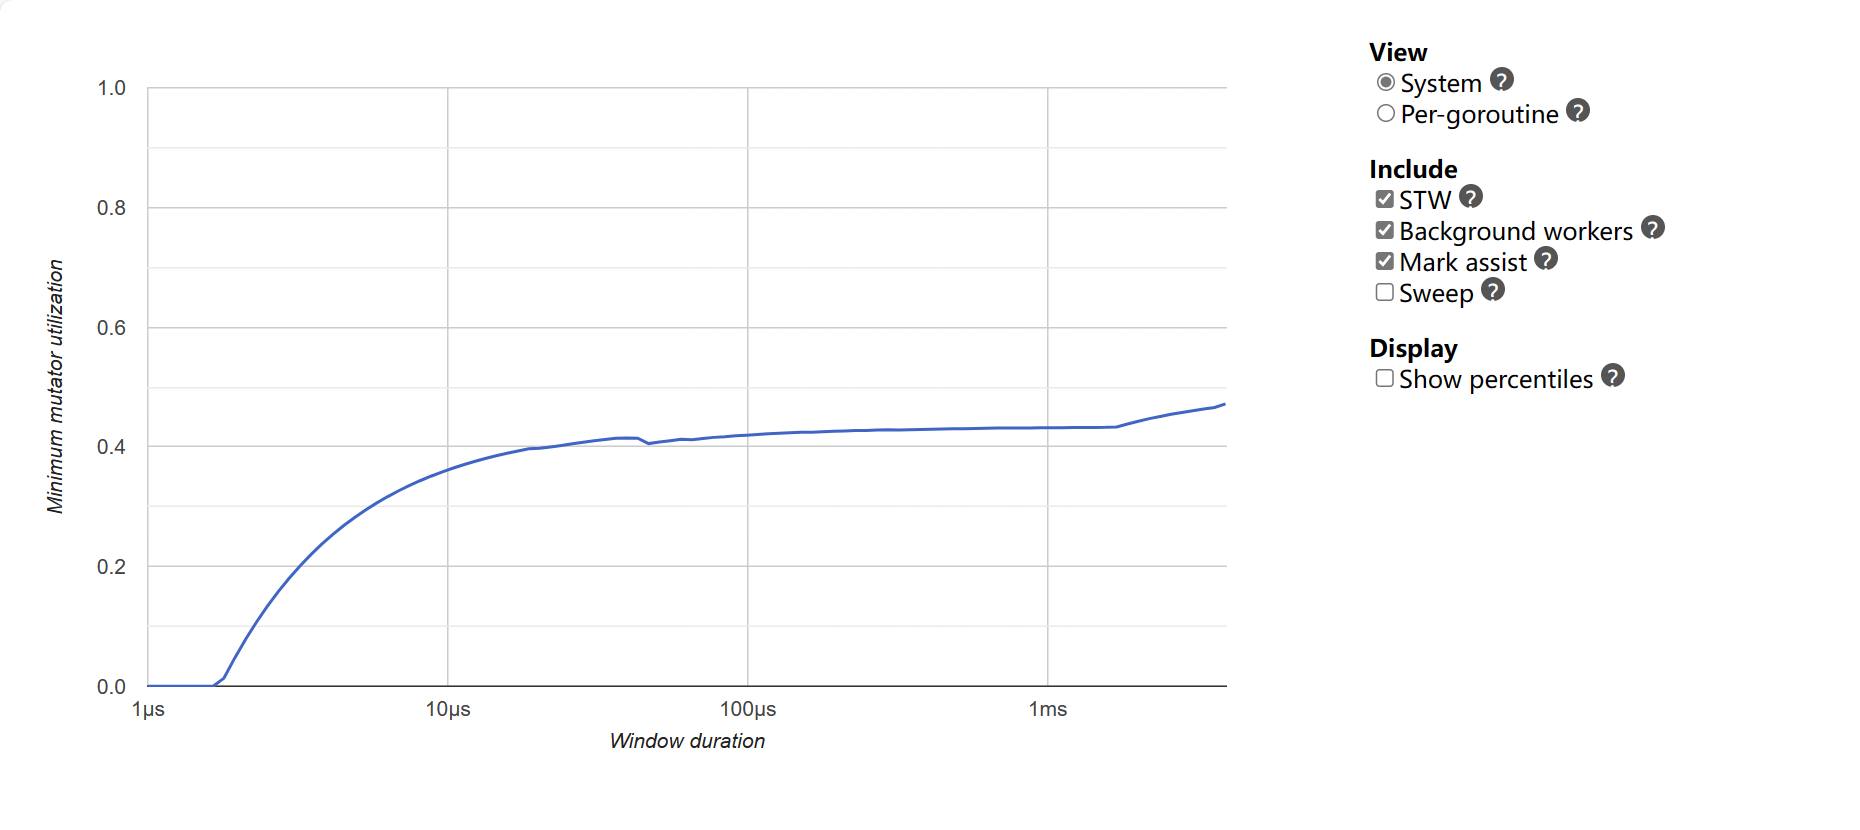
Garbage collection metrics
Minimum mutator utilization: Shows the maximum time consumption of recent GC